Last updated: June 11, 2026
Financial Command Center
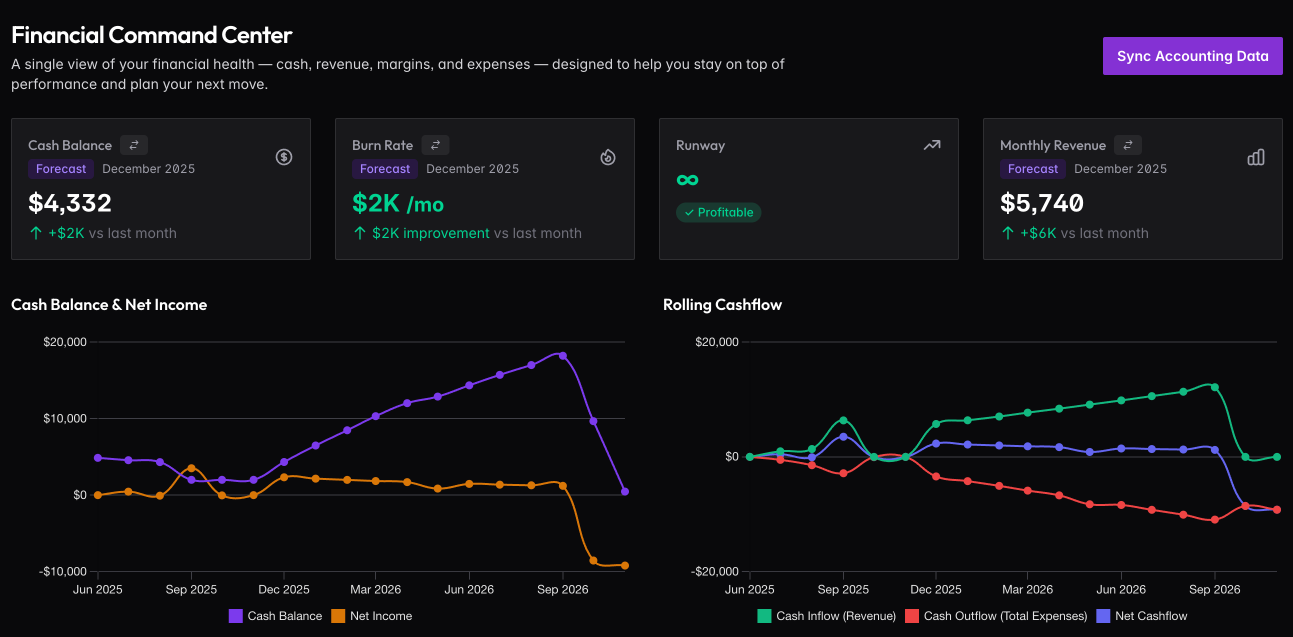
A single view of your financial health — cash, revenue, margins, and expenses. This is where you check how things are going and plan your next move.
Key Metrics
Four cards at the top show what matters most: Cash Balance, Burn Rate, Runway, and Monthly Revenue. Each shows the current value, whether it’s from actuals or forecast, and the trend versus last month.
Runway is color-coded: green means 18+ months (healthy), yellow means 6-18 months (start planning), red means under 6 months (urgent attention needed).
Charts
Cash Balance & Net Income shows your cash trend over time alongside monthly profit or loss. Watch for the lines diverging — that tells you if you’re building or burning reserves.
Rolling Cashflow breaks down where money comes from (revenue) and where it goes (expenses), with net cashflow showing the balance.
Rolling P&L & Cash Statement
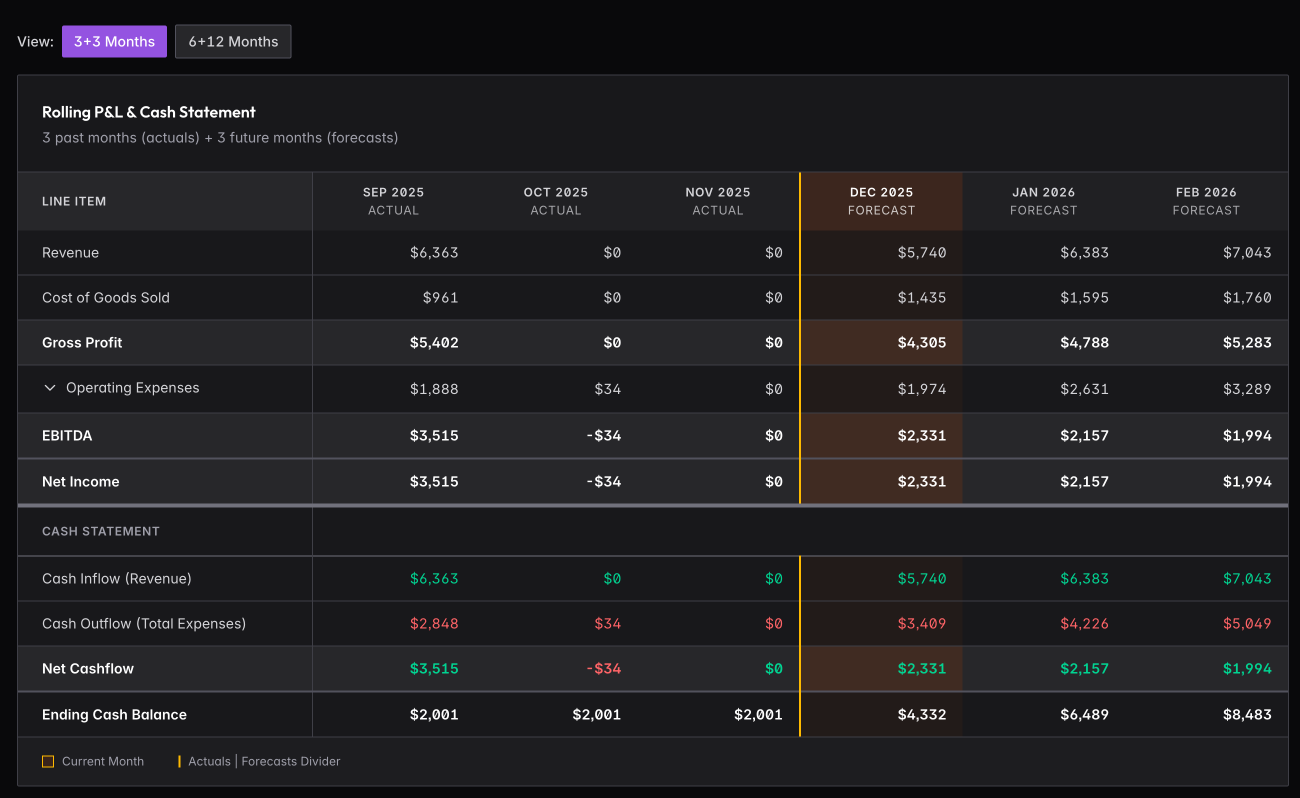
The table shows past months (actuals) alongside future months (forecasts) in one view. Toggle between 3+3 months or 6+12 months depending on how far out you want to see.
Revenue flows down through COGS to Gross Profit, then Operating Expenses to EBITDA and Net Income. The Cash Statement shows the same period with inflows, outflows, and ending cash balance.
Click Sync Accounting Data to pull the latest from Xero or QuickBooks.
Variance Analysis
Compare your actual performance against forecasts to understand where you’re on track and where you need to adjust.
Actuals vs Forecast
When you have both actuals and forecasts for the same period, the system shows:
- Variance Amount — Difference between actual and forecast
- Variance Percentage — How far off you are in percentage terms
- Variance Status — Color-coded indicator from green (on track) to red (significant variance)
Understanding Variance
Revenue variance: Is actual revenue above or below your forecast? Investigate the causes — deal timing, growth rate changes, or one-time items.
Expense variance: Are you under or over budget? Identify which categories are driving the difference.
Using Variance Data
Monthly review: Check variance at month-end when actuals are complete. Identify the biggest variances and understand the causes.
Forecast updates: Use variance patterns to improve future forecasts. If you consistently miss in one direction, adjust your assumptions.
Course correction: Large expense overruns need attention. Determine if it’s a one-time issue or ongoing trend.
Data Sources
The Command Center pulls from multiple sources:
- Actuals — Imported from accounting software or entered manually
- Forecasts — Your projections from the Forecasts section
- KPIs — Calculated metrics like burn rate and runway
For best results, keep your accounting connection synced and forecasts updated monthly.